



Jacob Montague
How Jacob Montague turned discovery into repeat listening for Aquatic and his catalogue through an artist-owned playlist and targeted conversion ads.
- Growth in super listeners
- +116%
- 173 to 373 super listeners
- Monthly listeners
- 32,802
- Up from 24,809
- Monthly active listeners
- +1,257
- 5,079 to 6,336
- Saves on album release day
- 436
- Artist-wide on 25 June 2026
Audience comparison: 1–28 May 2026 vs 28 Jun–25 Jul 2026 · rolling 28-day audiences. Growth rounded to the nearest whole percent.
An audience that comes back.
Jacob Montague is a producer, multi-instrumentalist and cinematic folk composer whose music is built from organic textures, quiet detail and a sense of place. Also known for his work with The Macarons Project, he was preparing to release his instrumental album, Aquatic.
The aim was to strengthen Jacob’s core audience, increase meaningful engagement and support long-term discovery. A discovery playlist opened the door. Conversion ads introduced swell. By the album release, a more engaged audience was already listening.
01 Discovery starts with the right setting.
Introduce a world of music.
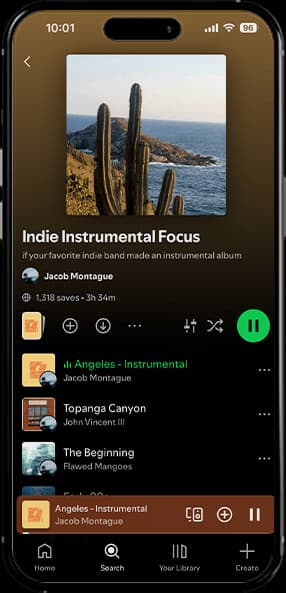
We created Indie Instrumental Focus around several tracks from Jacob’s catalogue, placing them alongside established instrumental artists with a similar sound and atmosphere. Its premise was simple: “If your favorite indie folk band made an instrumental album.” Listeners could discover more than a single song, in a setting that already felt familiar.
Meta ads brought relevant listeners to the playlist, introducing Jacob’s catalogue to people likely to connect with its sound and atmosphere.
Designing for the right listener.
Chartmetric gave us a deeper look at the playlist’s visual identity and musical positioning. Audience alignment was built around these key moods.
This consistency helped listeners immediately understand the experience being offered. It strengthened the playlist’s ability to match Jacob’s work with people who shared similar listening preferences, going beyond genre to a deeper emotional connection.
The playlist gave new listeners a reason to stay, explore the catalogue and return.
Top moods
43 moods represented
- Chill
- Melancholic
- Nostalgic
- Contemplative
- Meditative
- Dreamy
- Emotional
02 Give discovery somewhere to lead.
Familiarity before release day.
With listeners already exploring the catalogue, swell became the emotional bridge into the album. Researched audience groups and engaging ad creative shaped conversion ads that introduced the track to people likely to connect with its sound and atmosphere.
The campaign report recorded a 22.9% intent rate, reflecting listeners saving the track or adding it to playlists. That engagement gave the album a warmer audience to arrive to.
swell
The single introduces the album’s world.
Aquatic
The album arrives with an audience already engaged.

436 saves in a day.
Artist-wide saves recorded on album release day.
03 More listeners.
A deeper connection.
Audience growth
View data
| Date | Monthly listeners | Active listeners | Super listeners |
|---|---|---|---|
| 28 May 2026 | 24,809 | 5,079 | 173 |
| 29 May 2026 | 24,886 | 5,156 | 173 |
| 30 May 2026 | 24,819 | 5,171 | 175 |
| 31 May 2026 | 24,699 | 5,161 | 175 |
| 1 Jun 2026 | 25,573 | 5,172 | 179 |
| 2 Jun 2026 | 26,010 | 5,206 | 172 |
| 3 Jun 2026 | 26,622 | 5,247 | 173 |
| 4 Jun 2026 | 27,194 | 5,279 | 172 |
| 5 Jun 2026 | 27,607 | 5,284 | 177 |
| 6 Jun 2026 | 27,850 | 5,320 | 181 |
| 7 Jun 2026 | 28,039 | 5,336 | 183 |
| 8 Jun 2026 | 28,181 | 5,332 | 177 |
| 9 Jun 2026 | 28,545 | 5,362 | 183 |
| 10 Jun 2026 | 28,870 | 5,370 | 187 |
| 11 Jun 2026 | 29,009 | 5,374 | 184 |
| 12 Jun 2026 | 29,179 | 5,375 | 183 |
| 13 Jun 2026 | 29,319 | 5,397 | 179 |
| 14 Jun 2026 | 29,296 | 5,390 | 185 |
| 15 Jun 2026 | 29,104 | 5,390 | 192 |
| 16 Jun 2026 | 29,249 | 5,420 | 194 |
| 17 Jun 2026 | 29,668 | 5,435 | 198 |
| 18 Jun 2026 | 29,846 | 5,463 | 195 |
| 19 Jun 2026 | 30,077 | 5,475 | 202 |
| 20 Jun 2026 | 30,289 | 5,477 | 209 |
| 21 Jun 2026 | 30,346 | 5,492 | 207 |
| 22 Jun 2026 | 30,913 | 5,529 | 209 |
| 23 Jun 2026 | 31,339 | 5,584 | 211 |
| 24 Jun 2026 | 31,383 | 5,594 | 216 |
| 25 Jun 2026 | 31,456 | 5,633 | 235 |
| 26 Jun 2026 | 31,314 | 5,662 | 244 |
| 27 Jun 2026 | 31,280 | 5,719 | 249 |
| 28 Jun 2026 | 31,387 | 5,778 | 259 |
| 29 Jun 2026 | 31,345 | 5,885 | 272 |
| 30 Jun 2026 | 31,055 | 5,963 | 270 |
| 1 Jul 2026 | 30,898 | 6,060 | 277 |
| 2 Jul 2026 | 30,777 | 6,139 | 300 |
| 3 Jul 2026 | 30,743 | 6,193 | 307 |
| 4 Jul 2026 | 30,746 | 6,244 | 322 |
| 5 Jul 2026 | 30,807 | 6,330 | 328 |
| 6 Jul 2026 | 31,319 | 6,426 | 342 |
| 7 Jul 2026 | 32,037 | 6,528 | 359 |
| 8 Jul 2026 | 32,312 | 6,633 | 371 |
| 9 Jul 2026 | 32,297 | 6,652 | 377 |
| 10 Jul 2026 | 32,281 | 6,653 | 385 |
| 11 Jul 2026 | 32,333 | 6,654 | 391 |
| 12 Jul 2026 | 32,385 | 6,638 | 393 |
| 13 Jul 2026 | 32,938 | 6,668 | 394 |
| 14 Jul 2026 | 33,054 | 6,651 | 393 |
| 15 Jul 2026 | 32,976 | 6,631 | 397 |
| 16 Jul 2026 | 32,979 | 6,615 | 396 |
| 17 Jul 2026 | 32,996 | 6,606 | 405 |
| 18 Jul 2026 | 32,912 | 6,589 | 409 |
| 19 Jul 2026 | 32,930 | 6,578 | 406 |
| 20 Jul 2026 | 32,999 | 6,586 | 407 |
| 21 Jul 2026 | 32,921 | 6,565 | 405 |
| 22 Jul 2026 | 32,956 | 6,568 | 407 |
| 23 Jul 2026 | 32,878 | 6,510 | 398 |
| 24 Jul 2026 | 32,785 | 6,409 | 380 |
| 25 Jul 2026 | 32,802 | 6,336 | 373 |
The core audience grew with the reach.
Monthly listeners rose from 24,809 to 32,802. Alongside that wider reach, monthly active listeners increased by 1,257, and super listeners grew from 173 to 373.
Monthly active listeners represented around 19–20% of the audience at the two comparison points. More people were choosing to listen, with a larger group returning more deeply to the music.
Each date shows the preceding 28 days of listening. The active share describes the audience mix at each point.
04 The campaign ends.
The listening continues.
- Streams
- 2,558
- Listeners
- 254
- Streams per listener
- 10.07
A playlist with a life of its own.
Indie Instrumental Focus remained the strongest performer among the independent playlists shown in the 28-day report. Its listeners were returning to Jacob’s music well after paid promotion had stopped.
Daily streams by listening source
- Personalised playlists, autoplay & mixes
- Listeners’ own playlists & library
- Artist profile & catalogue
View data
| Date | Personalised playlists, autoplay & mixes | Listeners’ own playlists & library | Artist profile & catalogue |
|---|---|---|---|
| 1 Apr 2026 | 1,183 | 383 | 74 |
| 2 Apr 2026 | 1,019 | 426 | 48 |
| 3 Apr 2026 | 912 | 410 | 80 |
| 4 Apr 2026 | 667 | 306 | 90 |
| 5 Apr 2026 | 618 | 292 | 167 |
| 6 Apr 2026 | 1,165 | 402 | 56 |
| 7 Apr 2026 | 1,524 | 434 | 85 |
| 8 Apr 2026 | 1,480 | 419 | 72 |
| 9 Apr 2026 | 1,027 | 370 | 44 |
| 10 Apr 2026 | 881 | 419 | 141 |
| 11 Apr 2026 | 841 | 432 | 174 |
| 12 Apr 2026 | 999 | 316 | 56 |
| 13 Apr 2026 | 1,794 | 424 | 87 |
| 14 Apr 2026 | 1,482 | 428 | 166 |
| 15 Apr 2026 | 1,829 | 527 | 235 |
| 16 Apr 2026 | 1,348 | 461 | 163 |
| 17 Apr 2026 | 867 | 434 | 146 |
| 18 Apr 2026 | 944 | 366 | 112 |
| 19 Apr 2026 | 945 | 364 | 39 |
| 20 Apr 2026 | 1,036 | 421 | 135 |
| 21 Apr 2026 | 1,203 | 511 | 100 |
| 22 Apr 2026 | 1,113 | 492 | 125 |
| 23 Apr 2026 | 1,217 | 433 | 121 |
| 24 Apr 2026 | 1,197 | 426 | 227 |
| 25 Apr 2026 | 978 | 384 | 129 |
| 26 Apr 2026 | 1,027 | 368 | 158 |
| 27 Apr 2026 | 1,603 | 530 | 215 |
| 28 Apr 2026 | 1,538 | 457 | 140 |
| 29 Apr 2026 | 1,384 | 494 | 127 |
| 30 Apr 2026 | 1,281 | 460 | 152 |
| 1 May 2026 | 1,466 | 378 | 603 |
| 2 May 2026 | 1,381 | 358 | 85 |
| 3 May 2026 | 1,261 | 357 | 105 |
| 4 May 2026 | 1,423 | 463 | 148 |
| 5 May 2026 | 1,721 | 465 | 105 |
| 6 May 2026 | 1,128 | 441 | 160 |
| 7 May 2026 | 835 | 425 | 211 |
| 8 May 2026 | 870 | 375 | 96 |
| 9 May 2026 | 791 | 323 | 35 |
| 10 May 2026 | 947 | 339 | 60 |
| 11 May 2026 | 1,797 | 435 | 180 |
| 12 May 2026 | 1,240 | 498 | 133 |
| 13 May 2026 | 1,426 | 489 | 179 |
| 14 May 2026 | 1,644 | 439 | 186 |
| 15 May 2026 | 1,300 | 413 | 47 |
| 16 May 2026 | 1,096 | 362 | 198 |
| 17 May 2026 | 1,258 | 350 | 214 |
| 18 May 2026 | 2,133 | 399 | 143 |
| 19 May 2026 | 1,672 | 430 | 191 |
| 20 May 2026 | 1,422 | 481 | 128 |
| 21 May 2026 | 1,184 | 386 | 239 |
| 22 May 2026 | 1,020 | 427 | 337 |
| 23 May 2026 | 1,062 | 344 | 44 |
| 24 May 2026 | 1,080 | 360 | 200 |
| 25 May 2026 | 1,138 | 351 | 120 |
| 26 May 2026 | 1,519 | 416 | 152 |
| 27 May 2026 | 1,397 | 490 | 79 |
| 28 May 2026 | 1,395 | 450 | 519 |
| 29 May 2026 | 1,501 | 439 | 308 |
| 30 May 2026 | 1,123 | 333 | 248 |
| 31 May 2026 | 1,063 | 328 | 144 |
| 1 Jun 2026 | 2,738 | 385 | 298 |
| 2 Jun 2026 | 2,364 | 465 | 420 |
| 3 Jun 2026 | 2,248 | 470 | 380 |
| 4 Jun 2026 | 1,850 | 431 | 228 |
| 5 Jun 2026 | 1,773 | 402 | 118 |
| 6 Jun 2026 | 1,407 | 417 | 181 |
| 7 Jun 2026 | 1,254 | 344 | 211 |
| 8 Jun 2026 | 1,712 | 502 | 164 |
| 9 Jun 2026 | 1,759 | 526 | 217 |
| 10 Jun 2026 | 2,175 | 493 | 364 |
| 11 Jun 2026 | 2,094 | 443 | 236 |
| 12 Jun 2026 | 1,906 | 462 | 142 |
| 13 Jun 2026 | 1,454 | 346 | 94 |
| 14 Jun 2026 | 1,286 | 355 | 99 |
| 15 Jun 2026 | 1,854 | 447 | 199 |
| 16 Jun 2026 | 2,329 | 482 | 352 |
| 17 Jun 2026 | 2,212 | 492 | 257 |
| 18 Jun 2026 | 1,797 | 491 | 203 |
| 19 Jun 2026 | 1,754 | 448 | 168 |
| 20 Jun 2026 | 1,442 | 421 | 174 |
| 21 Jun 2026 | 1,185 | 350 | 169 |
| 22 Jun 2026 | 2,304 | 468 | 204 |
| 23 Jun 2026 | 2,191 | 495 | 209 |
| 24 Jun 2026 | 1,575 | 437 | 153 |
| 25 Jun 2026 | 1,767 | 439 | 1,090 |
| 26 Jun 2026 | 1,431 | 493 | 1,197 |
| 27 Jun 2026 | 1,181 | 410 | 590 |
| 28 Jun 2026 | 1,366 | 419 | 556 |
| 29 Jun 2026 | 2,091 | 518 | 1,018 |
| 30 Jun 2026 | 1,757 | 512 | 829 |
| 1 Jul 2026 | 2,241 | 523 | 965 |
| 2 Jul 2026 | 2,373 | 522 | 917 |
| 3 Jul 2026 | 2,290 | 497 | 736 |
| 4 Jul 2026 | 1,728 | 401 | 1,125 |
| 5 Jul 2026 | 1,696 | 440 | 796 |
| 6 Jul 2026 | 2,590 | 391 | 1,140 |
| 7 Jul 2026 | 2,870 | 576 | 1,188 |
| 8 Jul 2026 | 2,352 | 569 | 1,291 |
| 9 Jul 2026 | 1,967 | 520 | 568 |
| 10 Jul 2026 | 1,842 | 514 | 787 |
| 11 Jul 2026 | 1,501 | 481 | 434 |
| 12 Jul 2026 | 1,518 | 434 | 329 |
| 13 Jul 2026 | 2,611 | 500 | 298 |
| 14 Jul 2026 | 2,189 | 604 | 400 |
| 15 Jul 2026 | 2,133 | 527 | 340 |
| 16 Jul 2026 | 1,905 | 521 | 532 |
| 17 Jul 2026 | 1,913 | 524 | 197 |
| 18 Jul 2026 | 1,492 | 421 | 219 |
Algorithmic playlist streams
View data
| Source | Streams | Listeners | Songs |
|---|---|---|---|
| Radio | 34,636 | 16,023 | 10 |
| Discover Weekly | 6,596 | 3,675 | 3 |
| Mixes | 4,757 | 2,598 | 10 |
| Daylist | 2,290 | 1,633 | 10 |
Discovery beyond the original ad.
Radio, Discover Weekly, Mixes and Daylist all brought listeners to Jacob’s music. Radio generated 34,636 streams from 16,023 listeners across ten tracks in the reported 28-day window.
A separate daily snapshot on 13 July shows 2,611 streams from personalised playlists, autoplay and mixes. The music was continuing to find listeners through Spotify’s recommendations.
The campaign aimed to turn that engagement into further discovery: reach relevant listeners, encourage repeat plays and saves, and create more opportunities for the catalogue to be recommended. The continued listening was consistent with that aim.
Depth of listening
- Super listeners5%314 listeners53.0 streams / listener
- Moderate listeners26%1,550 listeners7.2 streams / listener
- Light listeners68%3,990 listeners1.7 streams / listener
View data
| Audience | Listeners | Reported share | Streams / listener |
|---|---|---|---|
| Super listeners | 314 | 5% | 53.0 |
| Moderate listeners | 1,550 | 26% | 7.2 |
| Light listeners | 3,990 | 68% | 1.7 |
| All active listeners | 5,854 | 100% | 5.9 |
Different listeners.
Different depths of connection.
In the separate audience-depth snapshot, super listeners averaged 53 streams each. Moderate listeners averaged 7.2, while light listeners averaged 1.7.
Those figures show why audience quality matters. A relatively small group of deeply engaged fans can return to a catalogue many times.
This breakdown is a separate report of 5,854 monthly active listeners, including 314 super listeners.
05 Let the audience shape the next chapter.
Active listeners by country
View data
| Country | Listeners | Active listeners |
|---|---|---|
| United States | 15,688 | 21.1% |
| Germany | 1,255 | 20% |
| United Kingdom | 2,130 | 17.6% |
| France | 616 | 17.2% |
| Australia | 1,556 | 16.7% |
| Italy | 359 | 15.9% |
| Canada | 2,055 | 15.7% |
Know where listeners are leaning in.
The United States combined the largest listener count among the countries shown with the highest active share: 21.1%. Germany followed at 20%.
These were useful signals for future targeting: markets where a meaningful proportion of listeners were actively choosing Jacob’s music.
Percentages represent active listeners within each country, rather than each country’s share of the total audience.
Give the right people a way into the music, a reason to return, and something to look forward to.
Your next release.
A longer-lasting audience.
The playlist created context. swell gave listeners an emotional focal point, and Aquatic arrived after familiarity and momentum had begun to build.
For independent artists, the lesson is to make the catalogue, focus track and audience data work together: introduce listeners to a wider world of music, give them a reason to return, and use their listening behaviour to shape what comes next. That is how a campaign can support discovery beyond release day and after paid promotion ends. Let’s build a campaign around the people most likely to connect with your music. Before planning your next release, read our artist reviews to hear what working with Decent is like.
Similar case studies


Ren Martinez
How Ren Martinez turned passive listeners into a long-term, emotionally engaged audience with Editorial Playlists, Ads and Press.
Hugo Brijs
London-based indie recording artist and acclaimed composer Hugo Brijs is known for his eclectic mix of alternative rock, electronic textures and hauntingly atmospheric melodies.